Statistics is a crucial tool in machine learning because it helps us understand the underlying patterns in the data. It provides us with methods to describe, summarize, and analyze data. Let’s see some of the basics of statistics for machine learning.
What is Statistics?
Statistics is a branch of mathematics that deals with the collection, analysis, interpretation, and presentation of data. It provides us with different types of methods and techniques to analyze data and draw conclusions from it.
Statistics is the foundation for machine learning as it helps us to analyze and visualize data to find hidden patterns. Statistics is used in machine learning in many ways, including model validation, data cleaning, model selection, evaluating model performance, etc.

Basic Statistics Concepts for Machine Learning
Followings are some of the important statistics concepts essential for machine learning −
- Mean, Median, Mode − These statistical measures used to describe the central tendency of a dataset.
- Standard deviation, Variance − Standard deviation is a measure of the amount of variation or dispersion of a set of data values around their mean.
- Percentiles − A percentile is a measure that indicates the value below which a given percentage of observations in a group of observations falls.
- Data Distribution − It refers to the way in which data points are distributed or spread out across a dataset.
- Skewness and Kurtosis − Skewness refers to the degree of asymmetry of a distribution and kurtosis refers to the degree of peakedness of a distribution.
- Bias and Variance − They describe the sources of error in a model’s predictions.
- Hypothesis − It is a proposed explanation or solution for a problem.
- Linear Regression − It is used to predict the value of a variable based on the value of another variable.
- Logistic Regression − It estimates the probability of an event occurring.
- Principal Component Analysis − It is a dimensionality reduction method used to reduce the dimensionality of large datasets.
Explore our latest online courses and learn new skills at your own pace. Enroll and become a certified expert to boost your career.
Types of Statistics
There are two types of statistics – descriptive and inferential statistics.
- Descriptive Statistics − set of rules or methods used to describe or summarize the features of dataset.
- Inferential Statistics − deals with making predictions and inferences about a population based on a sample of data
Let’s understand these two types of statistics in detail.
Descriptive Statistics
Descriptive statistics is a branch of statistics that deals with the summary and analysis of data. It includes measures such as mean, median, mode, variance, and standard deviation. These measures help us understand the central tendency, variability, and distribution of the data.
Applications in Machine Learning
In machine learning, descriptive statistics can be used to summarize the data, identify outliers, and detect patterns. For example, we can use the mean and standard deviation to describe the distribution of a dataset.
Example
In Python, we can calculate descriptive statistics using libraries such as NumPy and Pandas. Below is an example −
Open Compiler
import numpy as np
import pandas as pd

data = np.array([1,2,3,4,5])
df = pd.DataFrame(data, columns=["Values"])print(df.describe())
Output
This will output a summary of the dataset, including the count, mean, standard deviation, minimum, and maximum values as follows −
         Values
count    5.000000
mean     3.000000
std      1.581139
min      1.000000
25%      2.000000
50%      3.000000
75%      4.000000
max      5.000000
Inferential Statistics
Inferential statistics is a branch of statistics that deals with making predictions and inferences about a population based on a sample of data. It involves using hypothesis testing, confidence intervals, and regression analysis to draw conclusions about the data.
Applications in Machine Learning
In machine learning, inferential statistics can be used to make predictions about new data based on existing data. For example, we can use regression analysis to predict the price of a house based on its features, such as the number of bedrooms and bathrooms.
Example
In Python, we can perform inferential statistics using libraries such as Scikit-Learn and StatsModels. Below is an example −
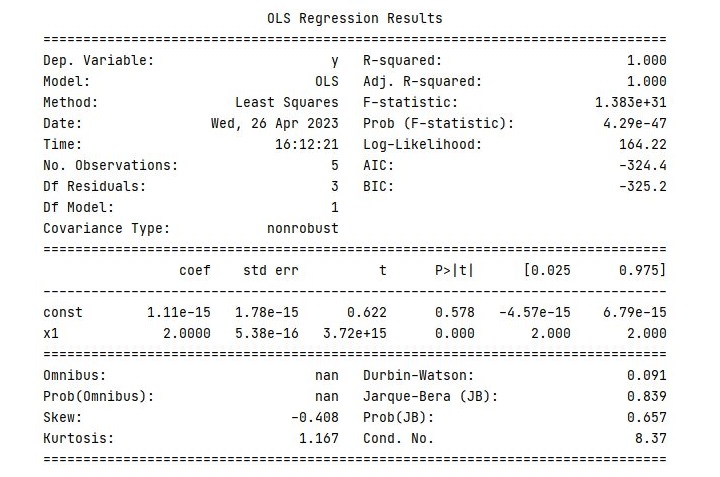
import statsmodels.api as sm
import numpy as np

X = np.array([1,2,3,4,5])
y = np.array([2,4,6,8,10])

X = sm.add_constant(X)
model = sm.OLS(y, X).fit()print(model.summary())
Output
This will output a summary of the regression model, including the coefficients, standard errors, t-statistics, and p-values as follows −
In the next chapter, we will discuss various descriptive and inferential statistics measures, which are commonly used in machine learning, in detail along with Python implementation example.
Leave a Reply